See what custom star maps Charta Caeli can make. Buttons below gallery apply to visible star chart shifted in front. Click button to view full-size star chart in PDF. Click for information about a star map's features and if you're keen to load a chart definition into composer click and use it as a template for your own awesome custom star chart.
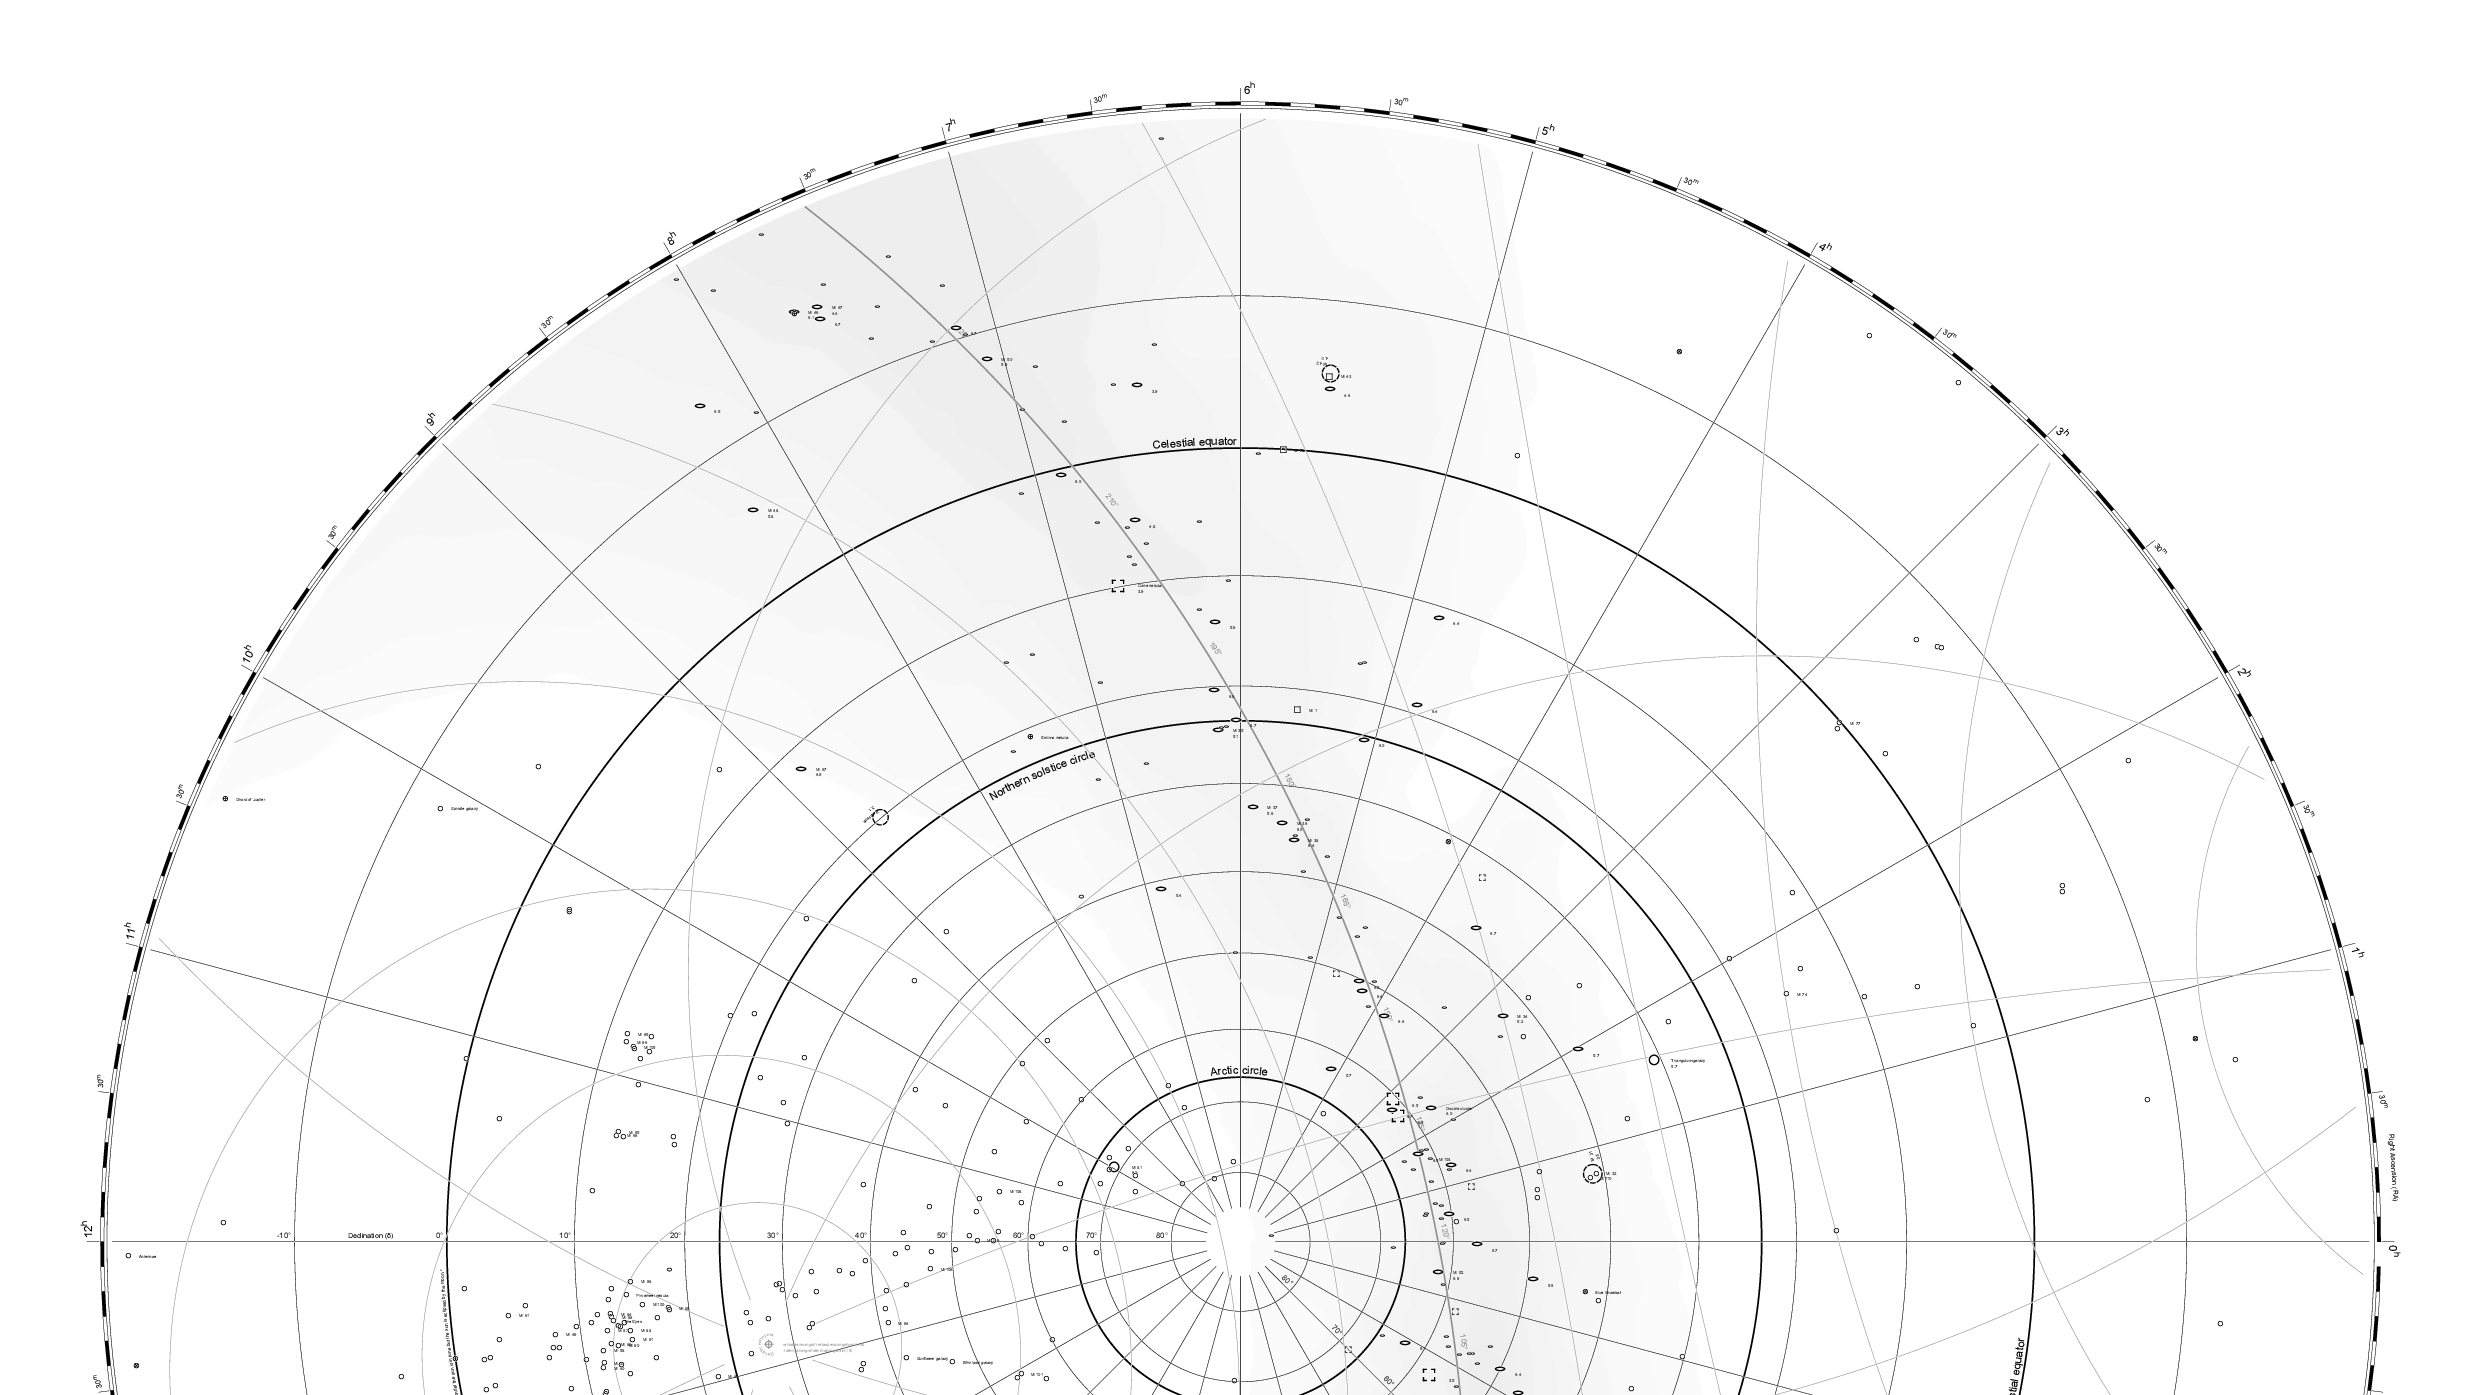
This is a quite common star chart. It shows an azimuthal projection of objects from the NGC 2000.0 catalog as one probably can see on the northern hemisphere. Object selection criterion is brightness, which restricts this map to objects with a mag value of 10 and below. Another criterion derives from the fact of the presence of multiple objects with identical common names in the supplementary file of the catalog. The select expression restricts those to the first one.
An application specific font provides the glyphs representing the different types of sky objects contained in the NGC 2000.0 catalog (for instance star, nebula, galaxy).
The focus of this custom chart is on the subject matter of giving precise information about the position of sky objects and their orientations with respect to different reference systems. A somewhat inaccurate element is the suggestion of the Milky Way, which nevertheless helps to orientate oneself in the night sky and not least is worth a mapping because of its mere extent.
The example applies the major elements that make up a custom chart definition, namely charts, horizons, circles, dials, annotations and catalogs. Grid and comments are faint and small but not too much to make sure they're useful and readable.
This outermost piece of XML data starts a chart definition. Actually, there is one more element above Chart but that’s essentially to group multiple chart definitions in a single file. Chart is of XSD type choice and serves to define the projection type, which in turn is a child of Chart. Furthermore, Chart defines the page dimensions of a custom star map and a viewport, which is a kind of passe-partout.
The Horizon elementSimilar to Chart this element serves to define a horizon type, which is sort of a synonym for coordinate system. Interpretation of object coordinates depends on their horizon type. For humans, three of these appear to be fix coordinate systems as they change only slowly due to sky mechanics: the equatorial, the ecliptical and the galactical one. Compared to these, the local horizon appears to be variable because local time is part of its definition.
The Circle elementThese serve to define grids to support orientation on a given custom star map. Circle as well is a choice to pick a particular type. Meridian and parallel circles draw lines of length and height, respectively. They are horizon dependent and correspond with longitudes and latitudes if for instance defined for a local horizon. There are four special Circle elements of type parallel to define the northern and southern tropic and polar circles.
The Dial* elementsAttached to a circle a dial provides a means of scale. The two types of dials are day and degree with the day type being a special one. The other one is fairly universal and suitable for appending a scale to any circle in a chart definition.
The Annotation elementThe specification foresees straight and curved annotations. The latter are useful to add comments that follow the paths of circles. Straight annotations happen to appear at the point where drawing stops. They refer to the page coordinate system. Many elements support annotations and thus a way to provide further explanations on them. A special case is the Frame element defined by the Layout element, which allows a more flexible positioning of straight annotations.
The Catalog elementCharta Caeli supports some of the more popular star catalogs for instance The Bright Star Catalogue. The Catalog element supplies a choice to pick a catalog type, which applied with an URL fetches the catalog data from Internet or local file. An expression supplied to the attribute value interpreter might restrict the output of catalog content.
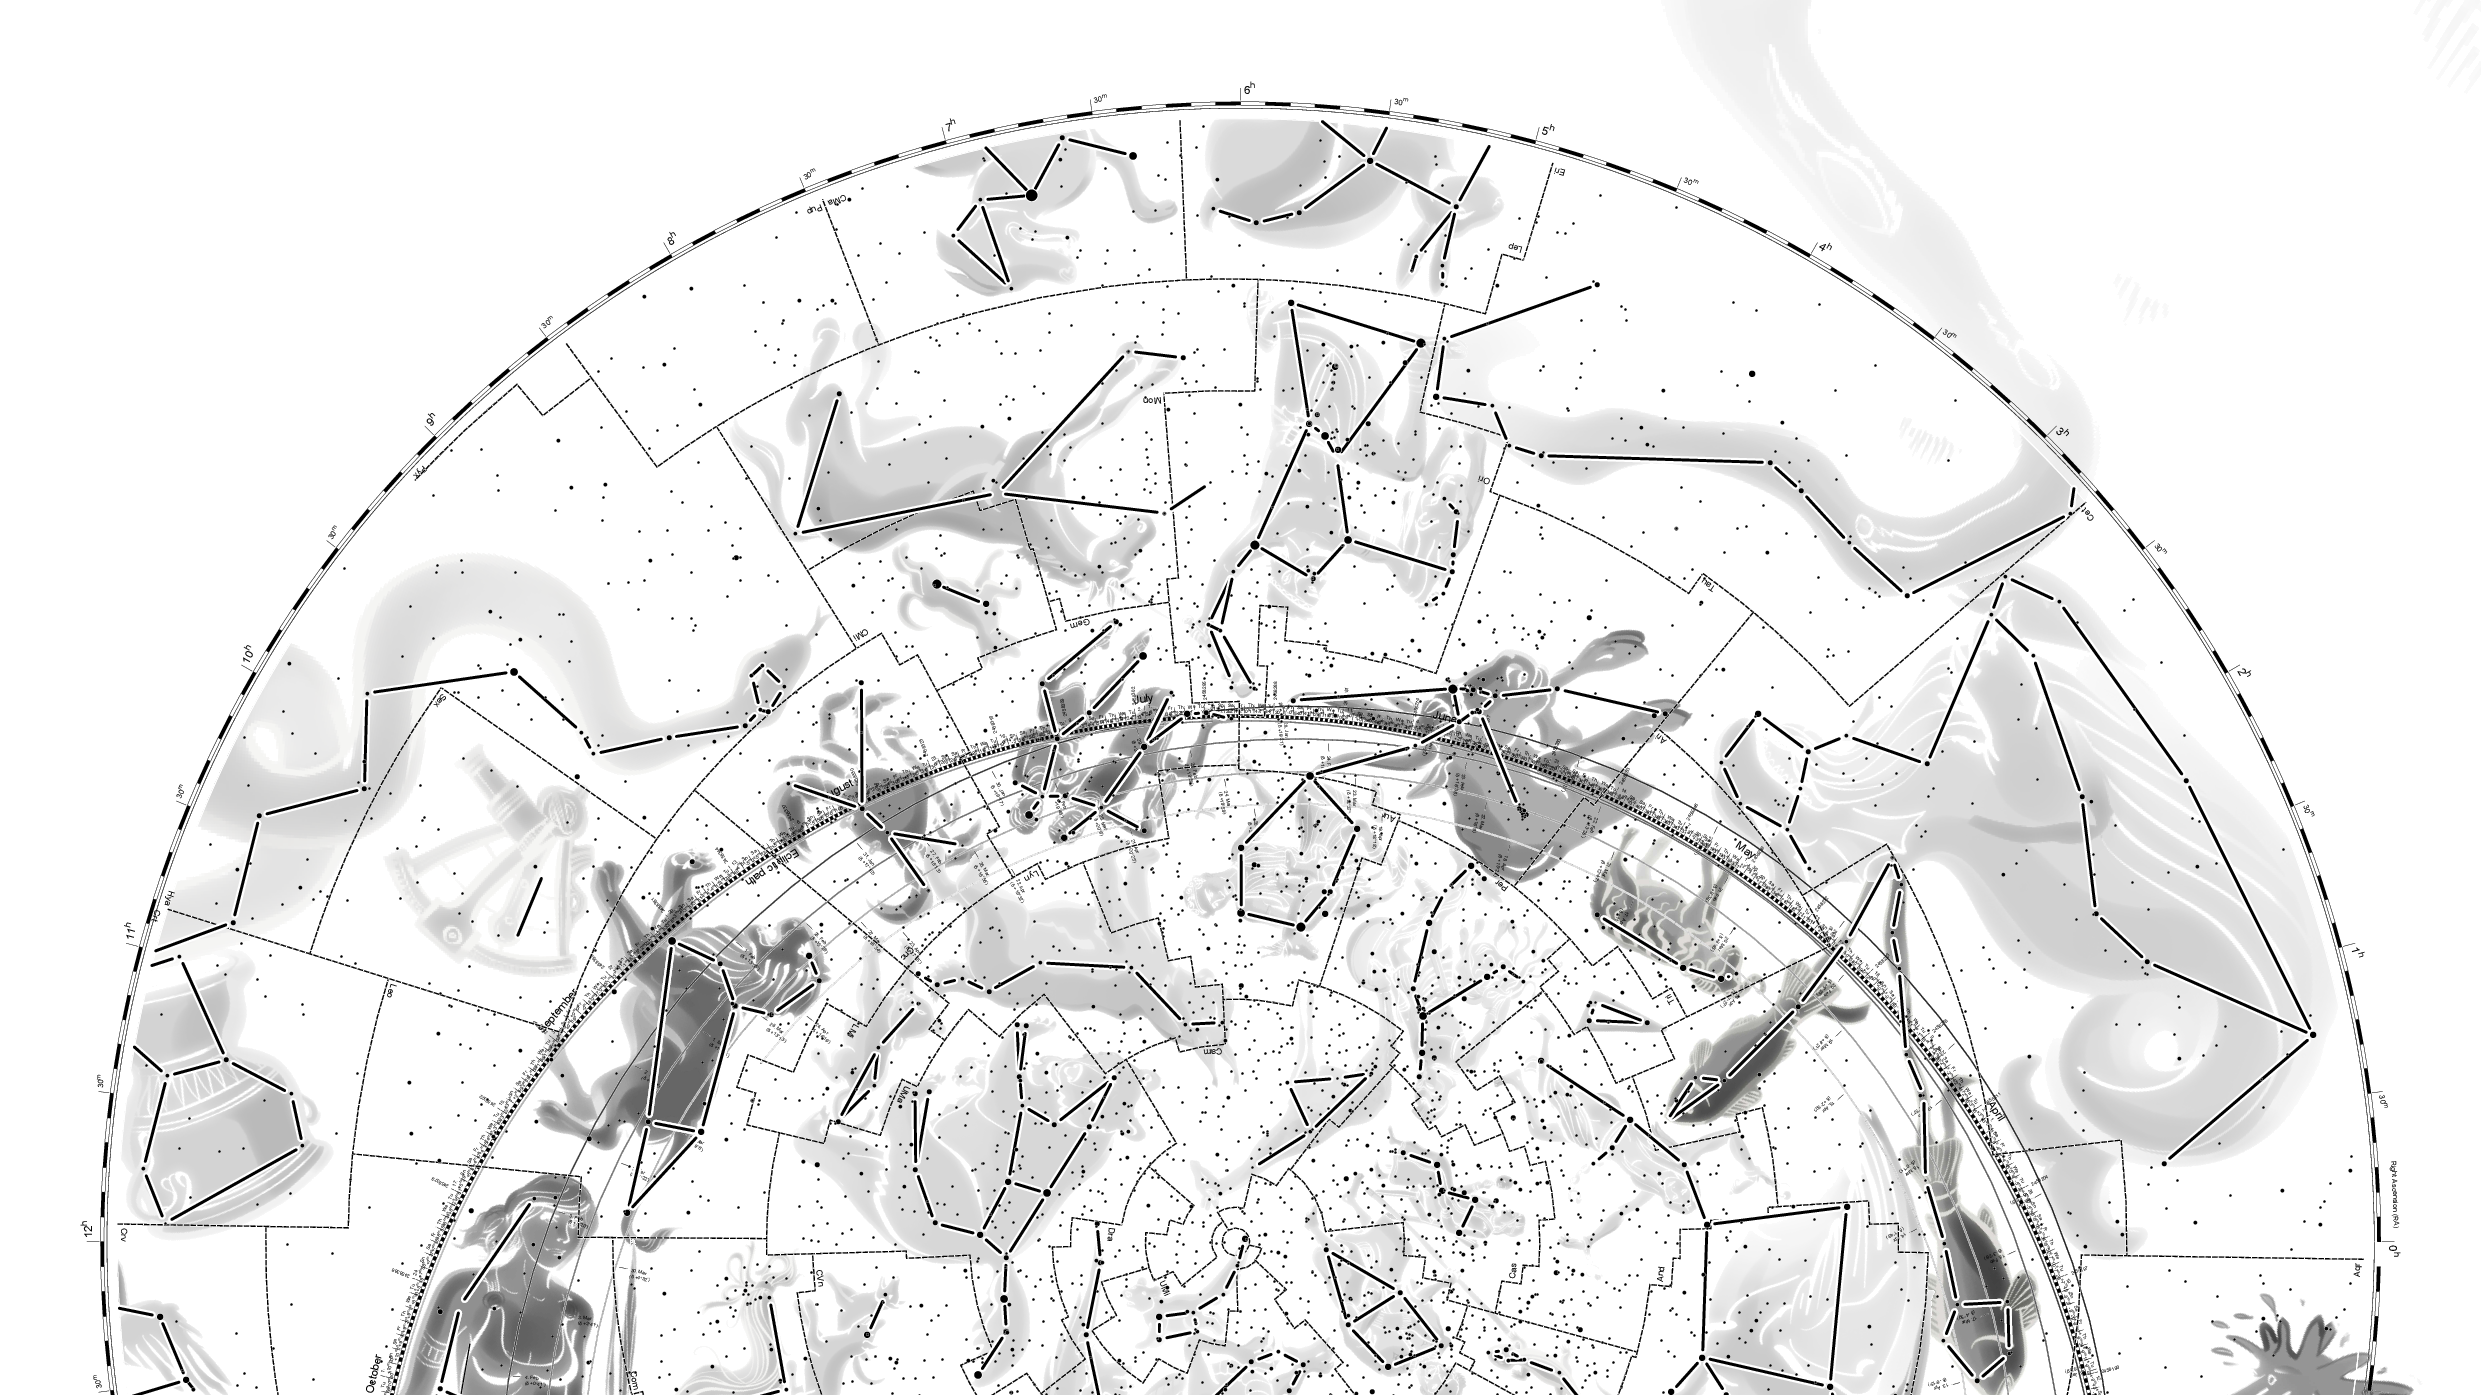
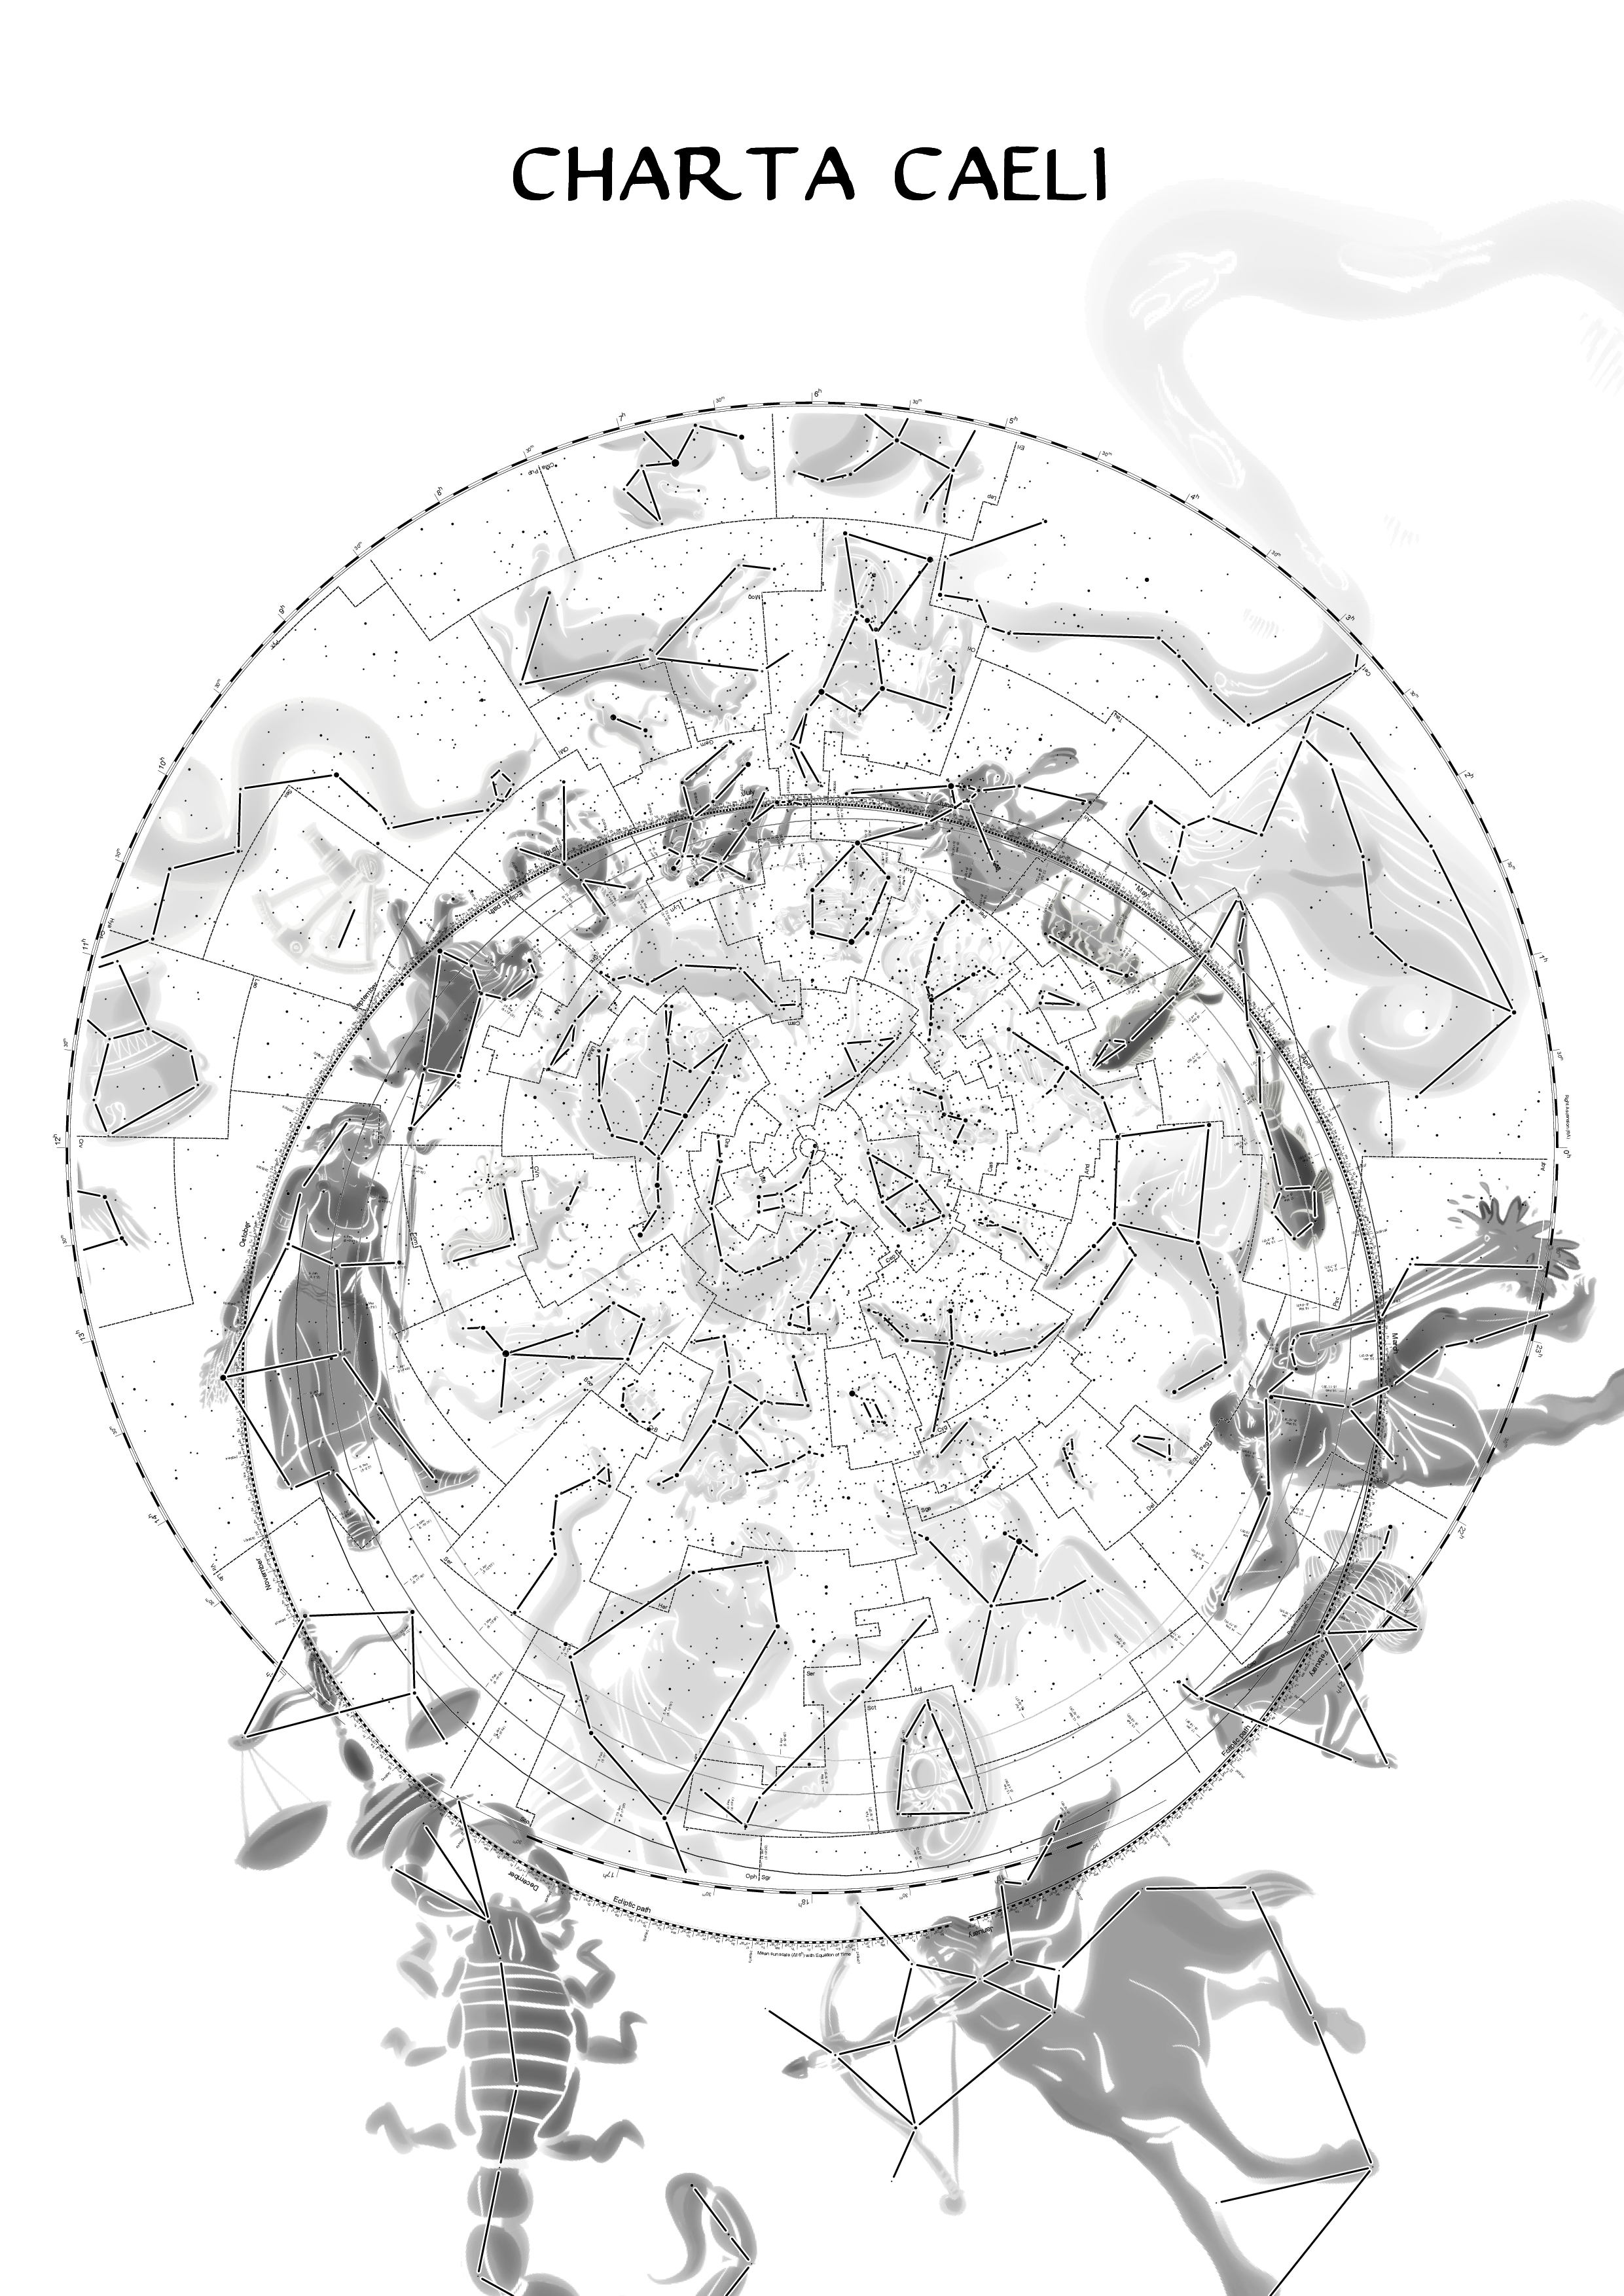
The custom star chart concentrates on styles and aims for a good-looking appearance. Despite there is no need for images of ancient constellations on a star map, it’s nice to see an artist’s impression of those constellations. Nor is it useful to stretch the orbits of the moon outward, to make it clear that it’s turning around earth several times a year. In addition, changes of the font style do not contribute to chart readability, nor does the fragmented and irregular grid. Overall, these somewhat mannered features make this star map quite interesting looking which might be an aim on its own.
The chart utilizes different shades of gray in combination with field of view to highlight meanings of constellations: the pale Eridianus seems to flow out of the star map in the top-right section, constellations that make up the Zodiac are dark and leave the chart at the bottom, while finally the other constellations in medium gray end at the chart border.
The chart definition uses the elements Artwork, Sign and Body besides the standard elements (for example Chart, Horizon, Circle). Of these three, only the latter is as well suitable for scientific star charts. The other two are for illustration purposes only, as their names reveal.
The Artwork element defines an image to be mapped at the skies or simply to put somewhere at the page. The example uses images provided by the Stellarium project by reference, which are rather easy to replace by others. The equatorial coordinates of three stars, which are part of a constellation and three corresponding coordinates of an image that depicts that constellation comprise the definition.
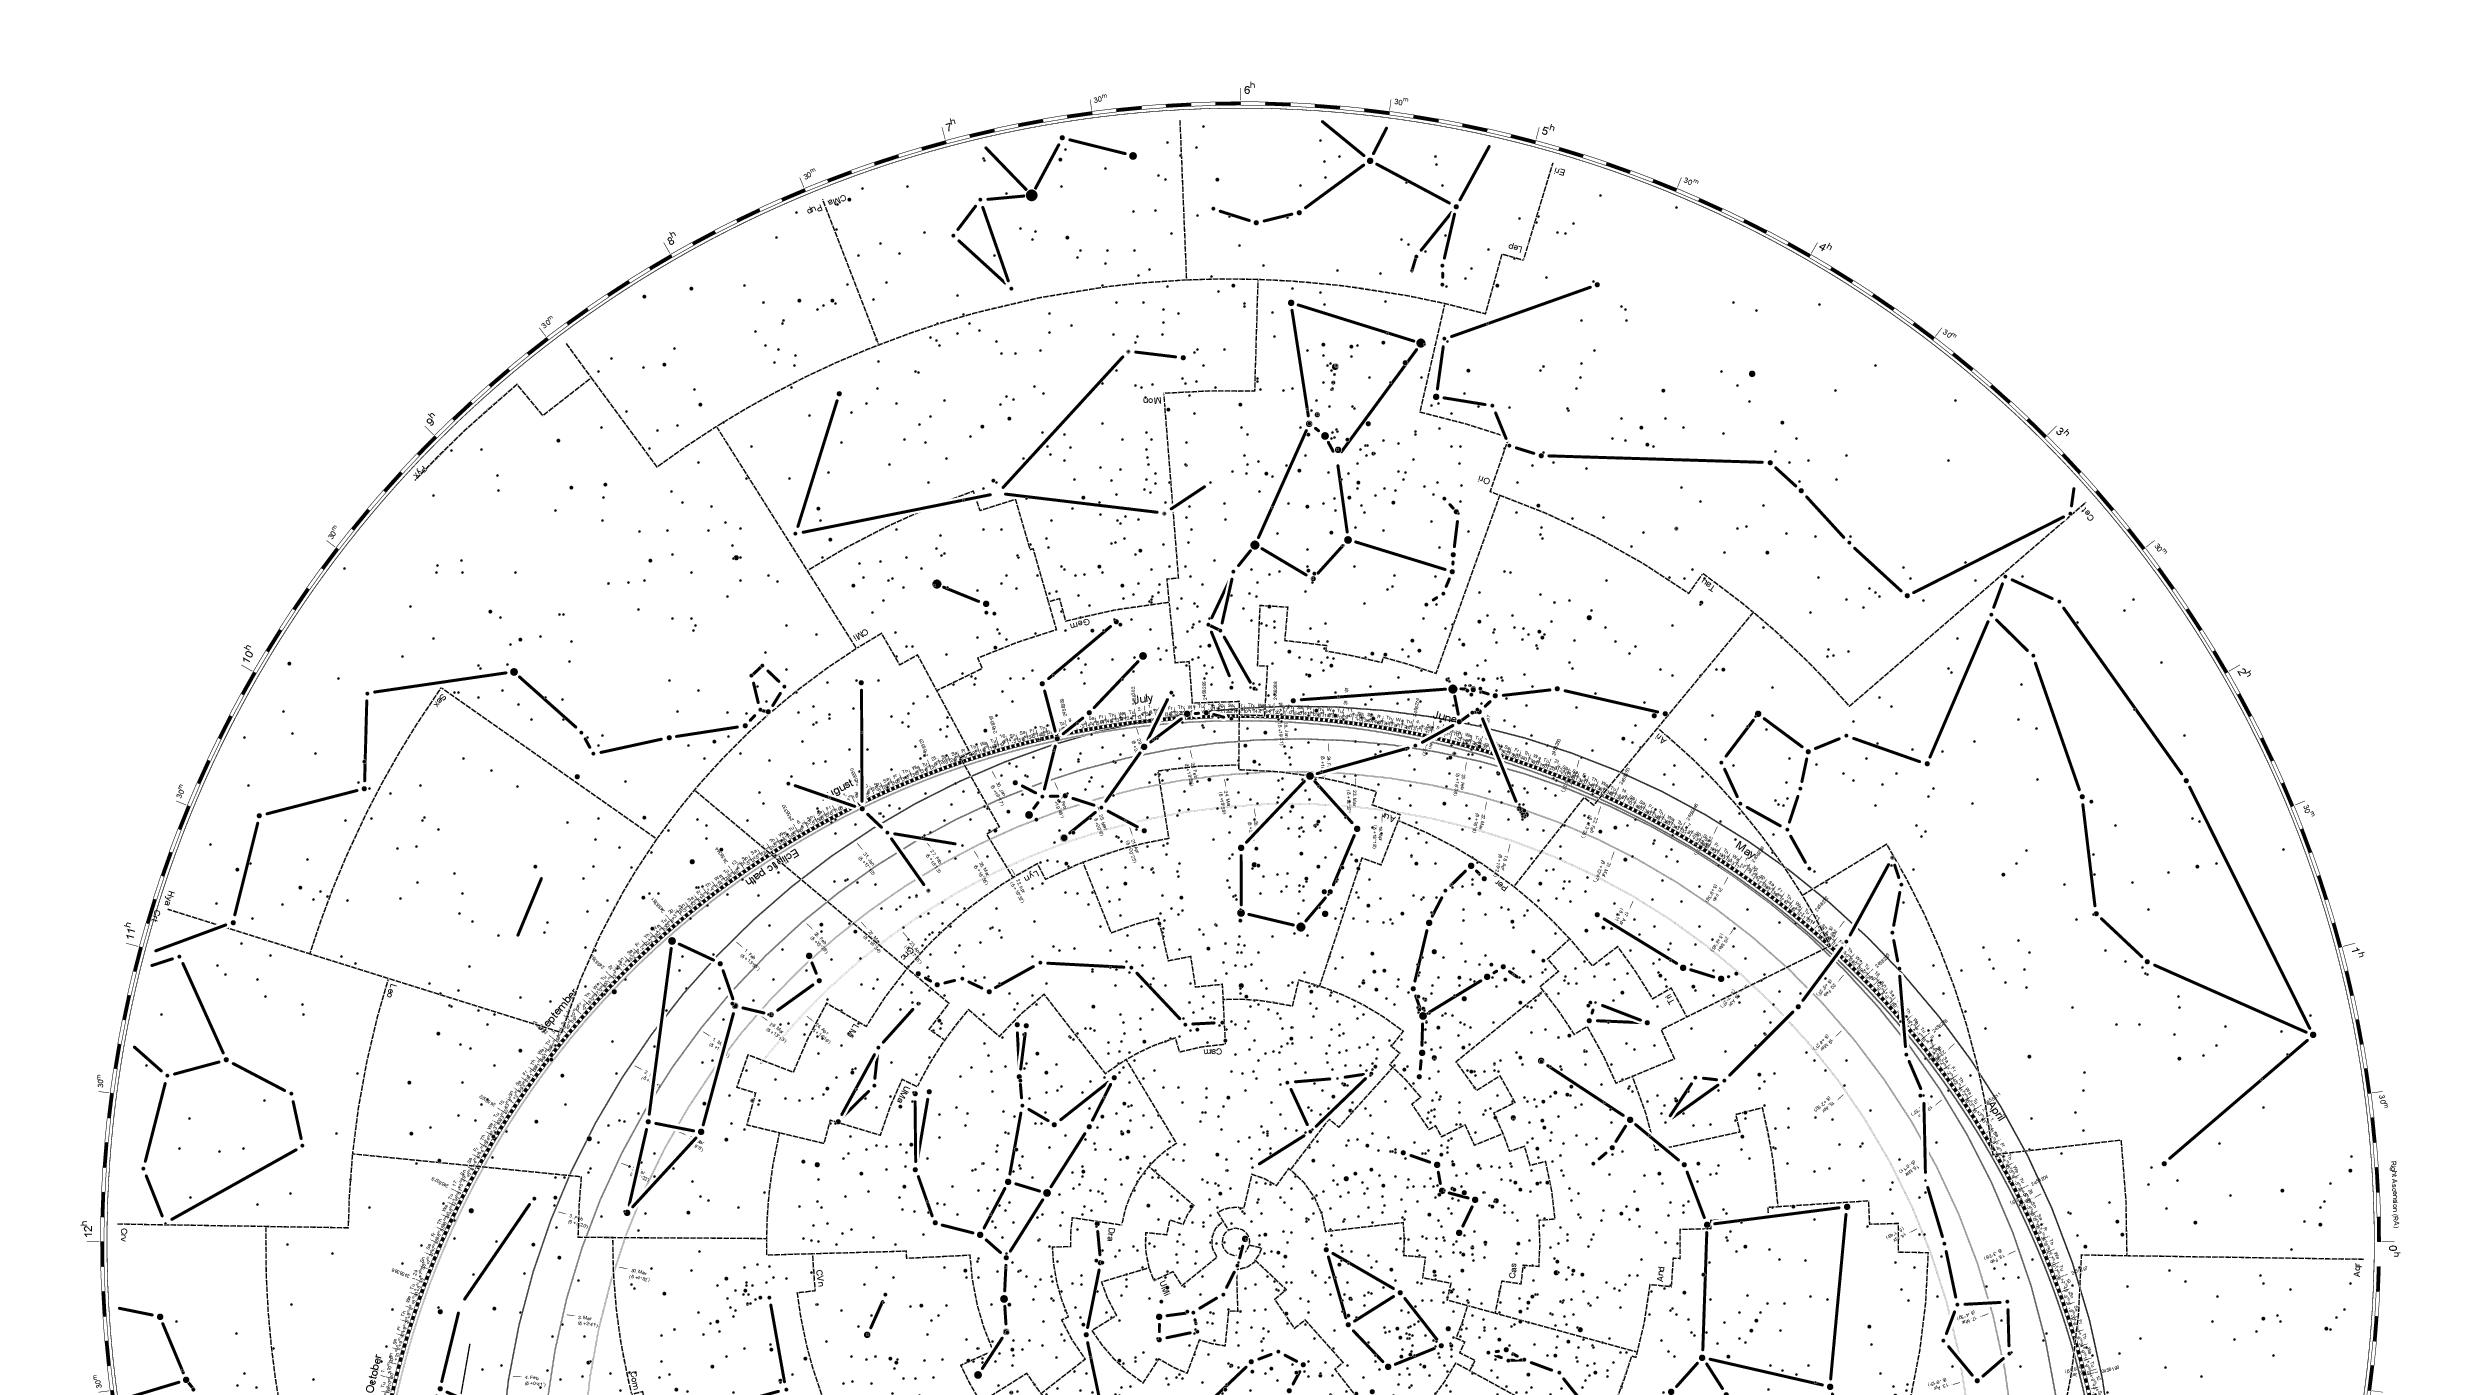
The Sign element provides a rather abstract method to show constellations by connecting sky objects with straight lines thus appearing like sort of stick figures.
The Body element represents any type of sky object supported by Charta Caeli. It provides a choice among various types: sun, planets and stars of course, but objects that are more general are foreseen as well, namely those following elliptical and parabolical paths like man-made satellites and comets. The Catalog element actually uses the star type element Body to draw objects.
Although not really a star chart and not even good-looking the definition gives practical insights on how to use some of Charta Caeli's concepts in practice. Having the chart definition from the repository at hands will further help understanding what’s going on.
The layout feature shown here uses a debug entry in the custom star chart specific preferences file to make the layout grid visible to the frames in use. One wouldn’t use this in a real star chart, but it is useful during development.
Position of text happens by combination of two anchor points from the text element and the frame in question. They sum up to nine for each: four for the corners, four for the middles of the edges and one for the center. The text anchor points actually refer to the bounding box of the text. Combining the anchor point values topleft and center of a text and a frame element yields a text starting in the top-left corner of the bottom-right frame quarter. The frame rectangles along the axes each show the frame number and the number of logical units these frames span.
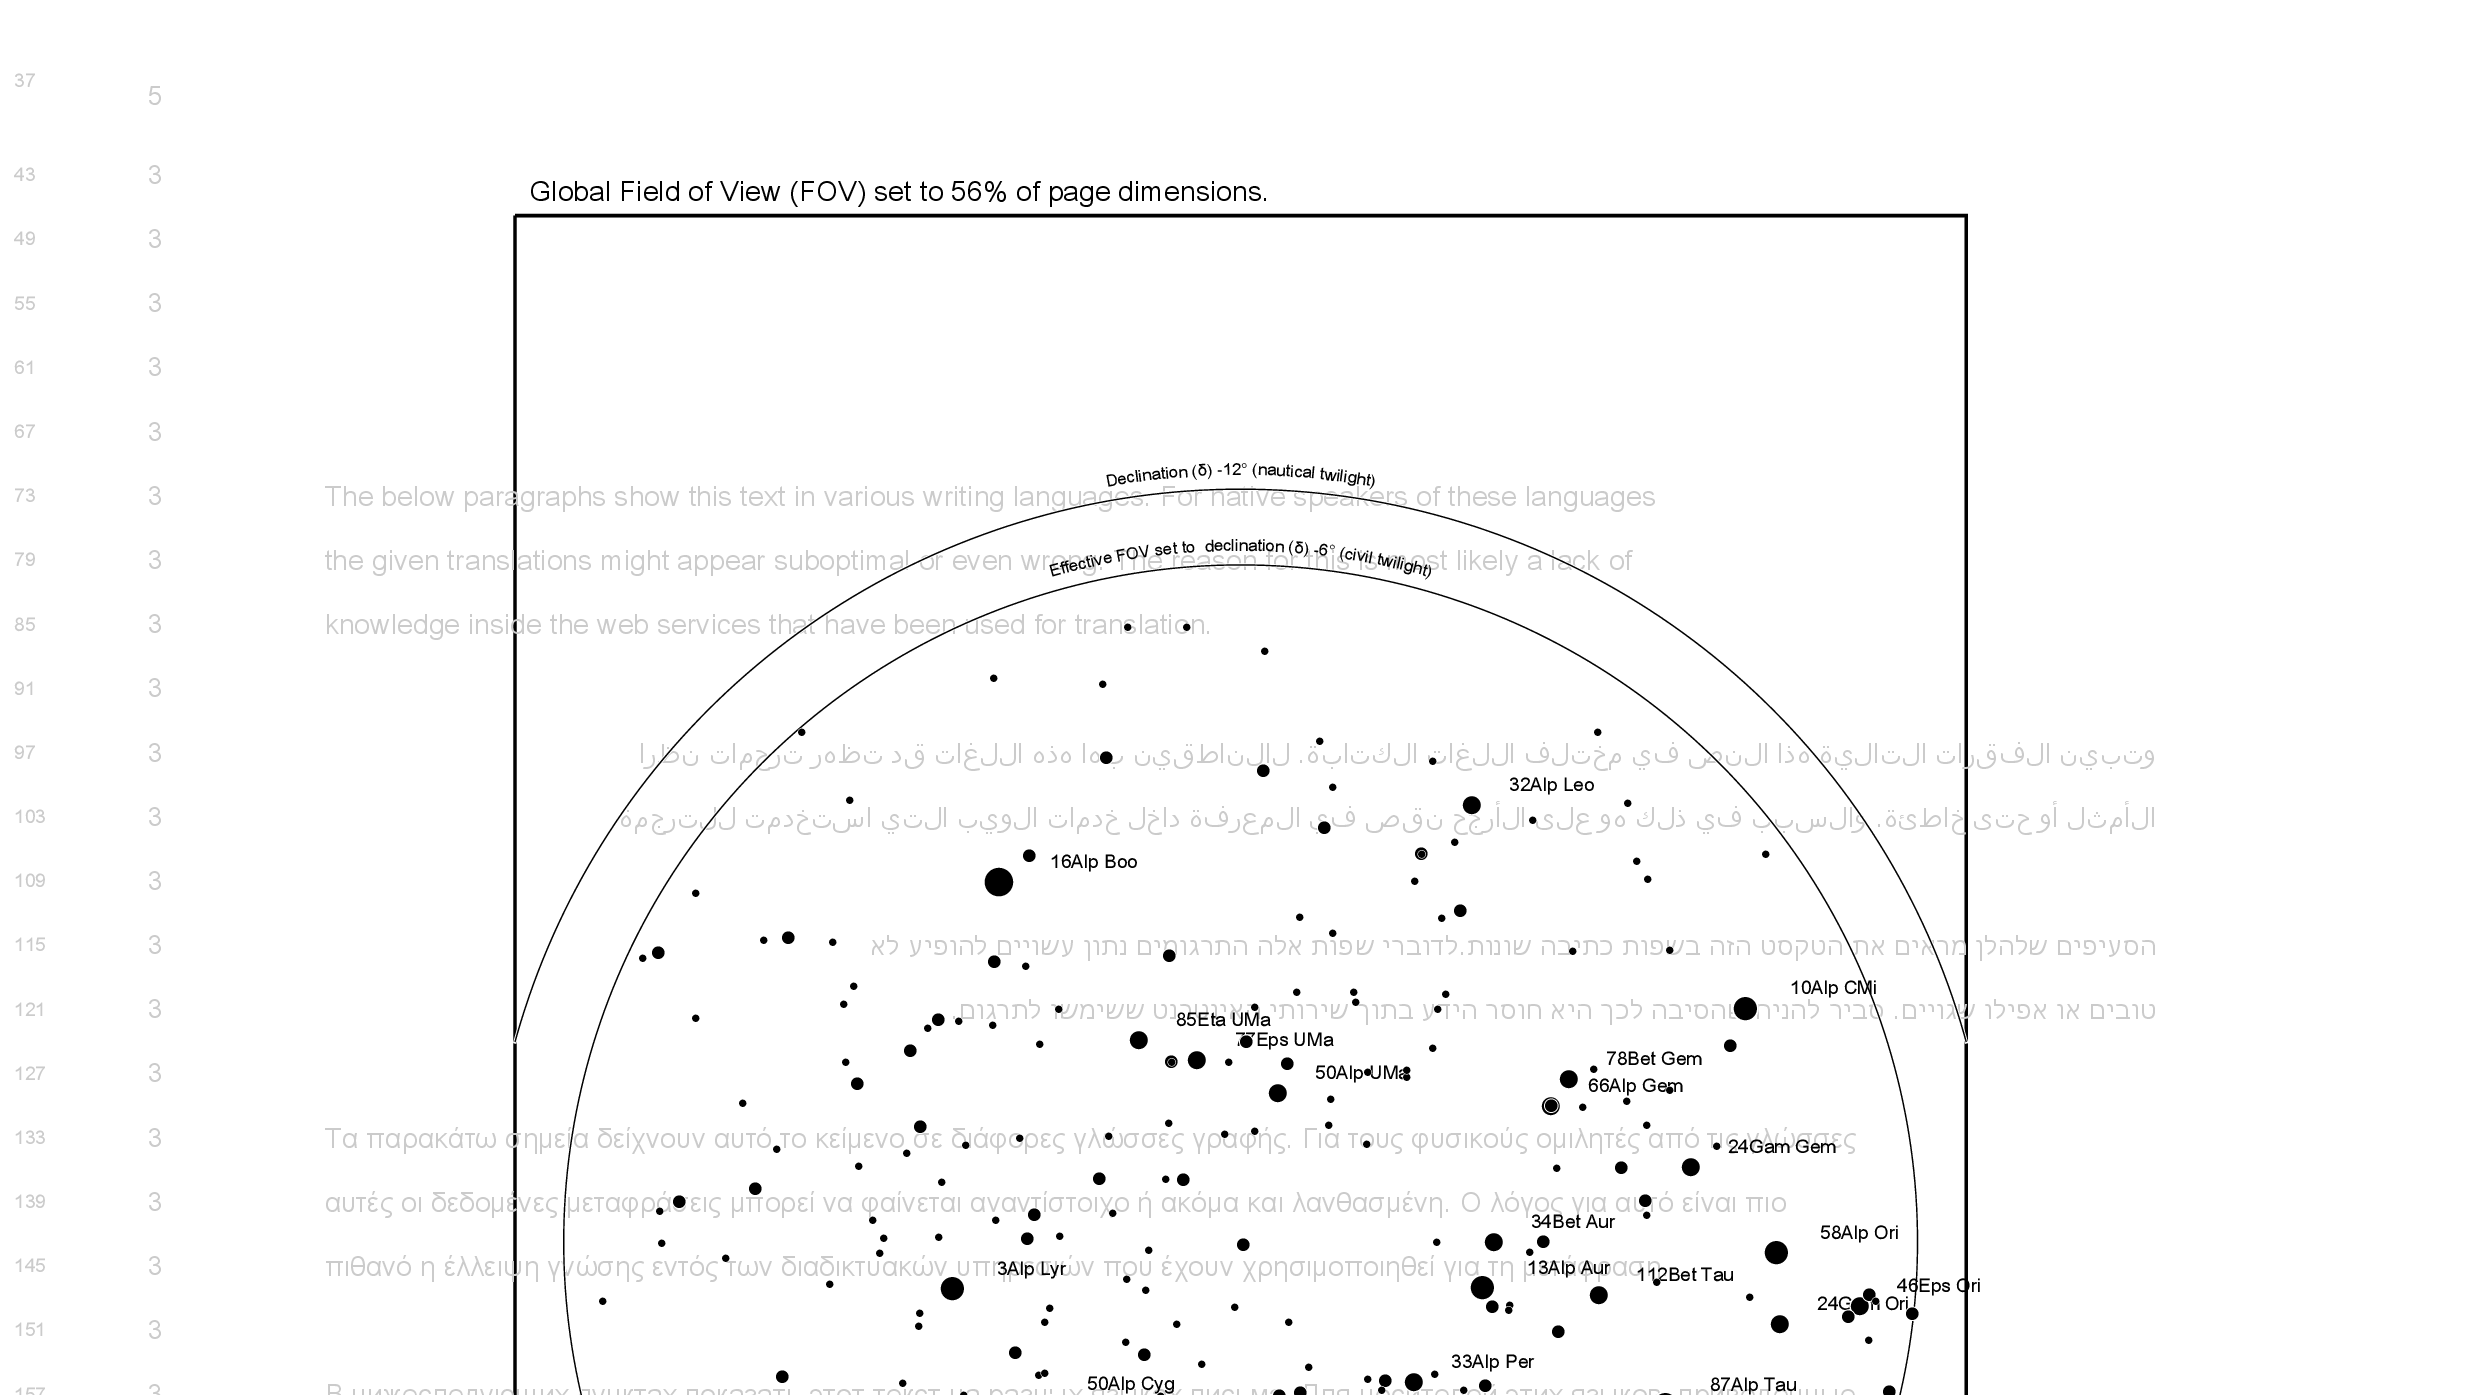
Unicode and fontsThe example uses the Arial Unicode MS font, which contains a large subset of glyphs defined by Unicode 2.1. The font is licensed and therefore not available in the Charta Caeli web service. Despite of this the example gives a good impression of what’s possible in terms of I18N if a respective font is available. Note multiple text elements for each language section in the chart definition, which is due to a lack of newline.
Field of viewThe inner circle in the middle shows an azimuthal projection of the stars in The Bright Star Catalogue. The circle is tagged as Field of View (FOV) thus restricting catalog output to the circle area. This is the so-called effective FOV, which affects catalog output as well as outputs from Artwork, Sign and Body elements. The outer circle has slightly flattened sections at the left and right side. These result from a combination with the passe-partout that restricts output of every element. This one is called global FOV.
Attribute value interpreterThis one enables to define values for some attributes at runtime during chart generation. The sample utilizes the feature to restrict stars output by the Catalog element on those with mag values of 3 and below. The interpreter provides access to certain runtime variables, simple arithmetic and string matching as well as conditions cribbed from C’s ternary conditional operator. Complex expressions tend to be difficult to read because of escapes for reserved characters and use of XML character entity references. Luckily, there are online services for XML encoding/ decoding available to ease the task.
Charta Caeli generates PDF star charts from XML chart definitions according to a XSD chart specification. The overall architecture is similar to a three-piece Russian doll: On the outside there is a web service as an interface to the user. The web service contains the application, a compilation of several programs. At its core is a Java program that does the actual work.
The web service consists of a couple of programs and scripts. First, there is an Apache web server to provision the page to the user. Next, there is a REST API that connects the page with the application in the background which actually performs star chart generation. Tomcat provides REST API functionalities utilizing the Jersey framework.
ChartDB is the name of a database to persist requests and processing results. It is made up of a classical SQL database server with additional folder structure located in the file system external to the server. An ID stored with each database entry logically connects an entry with its particular folder and files.
RNNR is an abbreviation for Runner, a script that cyclically queries ChartDB for new requests. In case of one or more valid ones Runner takes the oldest and executes the Charta Caeli application on it. Finally, Runner updates ChartDB with processing result state and puts generated star charts and logs into the appropriate folder.
Star charts are kept for a couple of hours. The Cleaner script checks periodically for old requests and deletes their remains on the file system.
The application is a compilation of several programs and configuration files that jointly perform the task of transforming star chart definitions provided in XML into custom star maps in PDF. Which particular programs are used depends on what the chart definition requires. The minimum used for every star map is the Java core program which actually outputs Postscript, and the Ghostscript application to finally produce a PDF file. If the definition foresees artwork filtering further programs might be used (e.g. ImagaMagick). If a GPU is available and artwork is to be rendered there, the application executes a so-called kernel on that device.
A set of surrounding files controls the process of star chart generation. First, a preferences file maps logical or abstract values from the star chart definition to absolute numerical numbers and Postscript code. The preferences file aims to free the author of a star map from technical details, at least to a given extent. Font file (TTF) mapping is another function fulfilled by the preferences file. Then, there are properties files that supply language-specific information for logging. Another feature of these files is the provision of language-specific variable names to be used in star chart definitions. TrueType font files might provide character sets for specific or even exotic fonts to be used by both the core program and Ghostscript.
The Java program at the core of the Charta Caeli application architecture is a kind of puzzle made up of a number of rather good concepts and technologies picked from others. Castor does the XML and XSD handling. PJ Naughter's C++ implementation of Astronomical Algorithms from Jean Meeus' eponymous book serves the astronomical mathematics. Charta Caeli uses the Java Topology Suite to calculate common geometric functions and the application’s attribute value interpreter bases on Fritz Ritzberger’s RunCC parser generator. Alan Kaminsky's Java Parallel 2 Library does the CUDA stuff and last not least various libraries from Apache Commons are in place as well.
The curious and brave ones might want to check out the chartacaeli repository on GitHub and get it up and running on their local Windows or Linux boxes. Share your experiences in case you try...
Here is the place to jump-start your Charta Caeli custom star map experience. This specialized XML editor is for instant creating simple star chart definitions from scratch. It supports the whole chart specification as defined by XSD although UX/UI regarding hints on syntax or numerical ranges is poor. The editor even serves well in playing around with values of larger definitions as provided by the gallery. Things get hard however when it comes to chart definitions with hundreds of elements and in particular on mobile devices. Due to this, if you plan to define a large custom star chart from scratch consider using your favorite XML editor locally and upload the chart definition file when ready.
Too bad your display is too small for composer. You can still load and execute definitions from gallery or local files. To edit however you need a tablet or PC.
Custom star chart generation may take a couple of minutes. How long exactly depends mainly on the number of catalogs and artworks your star map definition contains.
Leave browser tab open until another dialog box comes up with your custom star chart.
If you insist on giving up generating your current star map, reload the page in the browser. Your request will continue in the background, but unfortunately there is no way to access the results.
Are you sure to proceed and discard your unsaved changes?
Server sent . Check if chart definition and preferences (if given) are valid. Server sent . There is not much you can do except try again later. Custom star chart generation or PDF conversion failed for some reason. See Charta Caeli log file for details. Ghostscript PDF converter error log might provide additional hints.
Loading Composer may strain your patience. How much depends on the size of the chart definition. Some star maps from Gallery for instance take about 15 seconds to load.
Reload page if in a hurry.
There are some major concepts that guided development of Charta Caeli. Some few had been there at the beginning of the project but most of them came up while working proceeds. One might call them requirements as well but the term concept implies weaker obliging. In fact, not every concept made it to a full implementation but only to a certain degree and few concepts even haven't been touched at all, yet.
The application shall produce custom star charts of high quality and precision that scale to arbitrary size. The star charts should reflect the aesthetical claims of individual users. Furthermore, the star maps meet to a certain extent possible scientific requirements in terms of precision and detail. This idea kicked off the project and it can therefore considered the core concept of Charta Caeli. Others are important as well but none of them more than this simple thing, namely to have a tool to create huge star charts, which are fun to look at and maybe to work with - in order specified.
The tool has to be self-contained. That is, once setup properly the system puts out a star chart according to the custom definition a user fed into it without any post processing. A subtopic of this concept is to capsule chart definitions in a single XML file optionally supplemented by definition specific preferences and properties files. Not a big thing indeed, but helpful to ease sharing.
Star chart definition syntax shall focus on the topic and provide a common terminology. Preferences and properties files store configurations necessary to support terminology as well as technical settings.
Charta Caeli shall support any international language. Although sounding easy this is a hard one because Postscript has no I18N built-in. Postscript font encoding cannot exceed a maximum of 256 different characters regardless how many characters a particular font contains. The concept however demands a mechanism to define and output any Unicode character as long as there is a font containing these characters.
The spark for Charta Caeli had been an artist's impression of an azimuthal projection of the northern and southern skies pinned to an office wall. The question was if a tool could generate that kind of poster and combine the aspect of being large and beautiful with scientific precision.
Gnuplot by chance became the tool of choice and Windows the development platform. Working on drafts evolved rapidly and soon there was a first chart showing a grid without stars. Astrolabe was the working title of the project. It was inspired by one of the first known astronomical tools used by ancient astronomers to find out what's going on in the sky. As features grew, the development environment grew as well until it finally was too complex to handle. Numerous scripts based on Cygwin had come into place to fill the growing gap of missing functionality in Gnuplot. At the end, a bulk of additional tools buried Gnuplot and the project migrated to Java. Eclipse became the IDE. Two concepts however survived the Gnuplot epoch, namely Postscript as the output format and some Postscript code borrowed from Gnuplot that allows typesetting subscript and superscript.
Moving to a proper programming environment with virtually infinite possibilities resulted quickly in a large number of spontaneous ideas for features. Defining and following some core concepts helped to keep the project on track. Collecting new ideas in a spreadsheet for later review helped focusing on current tasks without fear to forget valuable things.
From that point on more and more concepts, technologies and tools came to use during development. Some needed only once for special purposes but many became part of the environment which finally grew more complex than it was before it switched from Gnuplot to Java. One remarkable one is an implementation of an application-wide stack-oriented registry inspired by US Patent US6785691B1.
Java moved development efforts from wondering how to coding. Of course, that would had been the same with any other object oriented programming language but Java was there when the project reached for it. It seemed that XML was the markup language for everything and thus would meet the needs of chart definitions as well. Castor tied the chart specification XSD to the application and Altova's new XMLSpy Home Edition (unfortunately no longer available) pushed to the top of the project's most popular and free XML editors. There it still is although Altova stopped the edition. XMLStarlet and its XPath query features exposed to be the tools for any kind of XML access from scripts.
Poseidon from Gentleware was in use for a while to support application design with UML principles and to document the software at the same time. The approach dropped when JNI came into play and Poseidon’s code generator reached to his limits. PJ Naughter's AA+ library pushed the project towards JNI. He actually transcribed the whole mathematics from Jean Meeus' book Astronomical Algorithms to C++ code. The JNI wrapping of AA+ handled CXXWRAP a nifty tool from Dave Daeven that generates Java classes and C++ stubs automatically.
One of the bread and butter tasks in Charta Caeli is to convert Postscript output to PDF. The search for a robust tool easily led to Ghostscript, which got the job due to its fame and versatility. Various JAR files from Apache Commons made it into the project to fulfill other common tasks. The most persistent ones are those from Lang, Logging and Math because they remained until now. The latter however got reinforcement through the Java Topology Suite, which greatly simplifies the calculation of areal intersections as needed by the field of view feature.
The Unicode thing was underestimated. Turning the Gnuplot Postscript code excerpt into a more general print procedure and specifying preferences to configure the application to use fonts containing Unicode characters were the easy parts. Things got hard when it came to really define a Unicode font based on a given font file, say for Arial Unicode MS which contains thousands of glyphs. It was Cygwin, the Swiss knife for Linux developers caged by Windows, that once more managed to get the job done by orchestrating a couple of scripts and the TTFDUMP tool taken from a package provided by Microsoft. The scripts are in the repository. They are for ad-hoc usage and therefore poorly documented. They extract CMAP data and character strings from TrueType font files and finally merge these three data items into well-formed preferences file entries.
Though not regularly reported by the evening news there are some repositories for star catalogs. The Strasbourg astronomical Data Center for instance hosts a bulk of carefully maintained catalog files for public access. Almost all of them are ASCII encoded thus human readable files with each line representing a record, which in turn has fixed width fields or defines a special field separation character.
These catalogs were easy to implement and the project decided to support several of them right away, namely The Hipparcos and Tycho Catalogues, The Bright Star Catalogue, the SKY2000 Master Catalog, the NGC 2000.0 and the HYPERLEDA. I. Identification and designation of galaxies.
A special one but nevertheless supported is the Catalogue of Constellation Boundary Data which contains area information as the name might imply. However, the most special one because exclusively designed for Charta Caeli is the so-called DS9 catalog. It contains area information as well but these are from the Milky Way our home galaxy. A bundle of contour files comprises the catalog. Each file defines an area of approximately equal brightness. The file format is from a popular astronomical tool called SAOImage DS9 and utilized by the project to compile the catalog. Raw data is from Axel Mellinger's beautiful Milky Way panorama photography. SExtractor is the somewhat ambiguous name of another tool from the astronomical community used to extract the relevant data from Axel's image.
Implementing a simple inline interpreter for attribute values in XML files accompanied catalog development to have an option to select special catalog records. Fritz Ritzberger's Java Runtime Compiler Compiler RunCC made a solid impression and it was therefore an easy decision to make it join the tool zoo.
The incredible Gimp and hours of watching YT videos on how to use it, many of them watched more than once, led to a first website design. The artworks on the site you are just visiting are remnants of this project phase. Later ImageMagick supplemented the project's graphic tools with a CLI and allowed many of Gimp's GUI functions on the command line.
The Justinian font from Dan Zadorozny and its modern adaption of ancient typesetting situated somewhere between Greek and Roman was found to be a good representation of the projects aims. This impression is contrary to the assumption that the Roman emperor and name founder Justinian I. was a rather backward-looking ruler, but this does not detract from the impression of the font. With the introduction of the font, also the name got a change from Astrolabe to Charta Caeli. The Latin term still refers ancient astronomical science but according to Google, it doesn't appear in the terminology of the astronomical Internet community and was therefore considered unique in this context.
Providing a clickable sky atlas using mapper.js from We Work We Play was another feature temporarily followed by the project. Inspiration came from sample charts of the Interstellarum Deep Sky Atlas and the Millennium Star Atlas. Especially the first served the project as wonderful examples of lovingly crafted star charts.
Another feature inspired by the sample charts was an application specific font containing glyphs to differentiate special kinds of deep sky objects like galaxies, clusters and nebulae in an iconic manner. Implementing this resulted in a handcrafted Type 3 font and was a project on its own...
The project moved to the cloud. GitHub took over source code management, and the numerous copies of project files saved on USB sticks, external hard disks and DVDs became obsolete. Astrolabe and Charta Caeli each got its own repository whereas Astrolabe intentionally doesn’t build, but just holds a chronological archive of project states back to beginnings with Gnuplot.
The five-star open source planetarium program Stellarium provided the idea for an extension to draw artistic representations of the ancient constellations. It provided important parts of the mapping algorithm as well as beautiful drawings both cribbed and referenced by Charta Caeli, respectively. The derived algorithm turned out quite slow but luckily GPGPU came around the corner these days and the most challenging phase of the project began. A belly decision brought CUDA from NVIDIA into play and coincidentally Alan Kaminsky's Parallel Java 2 Library as well, which promised to minimize parallelization efforts.
However, things got complicated anyway due to the lack of a CUDA capable device. AWS filled the gap with a G2 instance but claimed a charge for it. Furthermore, Visual Studio Community had to join the toolset because the CUDA SDK won't run the compilers supplied by Cygwin. Moreover, to make things complete the CUDA SDK won't compile as well if there's no CUDA device. Therefore, the approach was to develop, compile and test as much as possible on local environment and to utilize AWS as a final step, ideally just to confirm everything's ok.
To accomplish this every piece of CUDA code, that is code executing on a CUDA capable device, got a local peer bound to the application via JNI and tested with JUnit. Even the so-called kernels at the very heart of any CUDA program, had been developed and tested this way before compiled for CUDA and deployed to the AWS instance. Fortunately, with some manual interventions the SDK compiled for CUDA even without an appropriate device. The details to this are in another repository on GitHub.
Finally, CUDA came to work and the algorithm boosted as expected. The German computer magazine c't published the approach and there is an English infographic as well which furthermore is free of charge.
This is a good time to mention the community on Stackoverflow and their priceless efforts for providing valuable answers to seemingly any problem or question a software developer might ever have.
Current work focuses on website development and integration with social media. Part of this was in focus earlier but suspended, mainly because there was no UI concept to create chart definitions in a browser. Then Xonomy from Michal Boleslav Měchura came into sight and gave the impulse to start actually working on a Charta Caeli web service.